Grafana - Keycloak 연동
Docker에서 구동 중인 grafana에서 Keycloak을 연동 해봤다.
grafana/grafana:11.6.1 / keycloak/keycloak:26.2.2
Container
CLI, Web
개요
- Grafana의 authentication을 Keycloak으로 사용하는 방법에 대해 찾아보고 적용 해본 뒤 기록을 위해 작성하였다.
- Keycloak의 User는 이미 생성 되어있는 상태에서 진행한다.
ref.
Keycloak에서 작업
1. Client 생성
Keycloak에 접속 후 좌측 메뉴 중 Manage → Clients에 들어가 Create client를 눌러 생성한다.
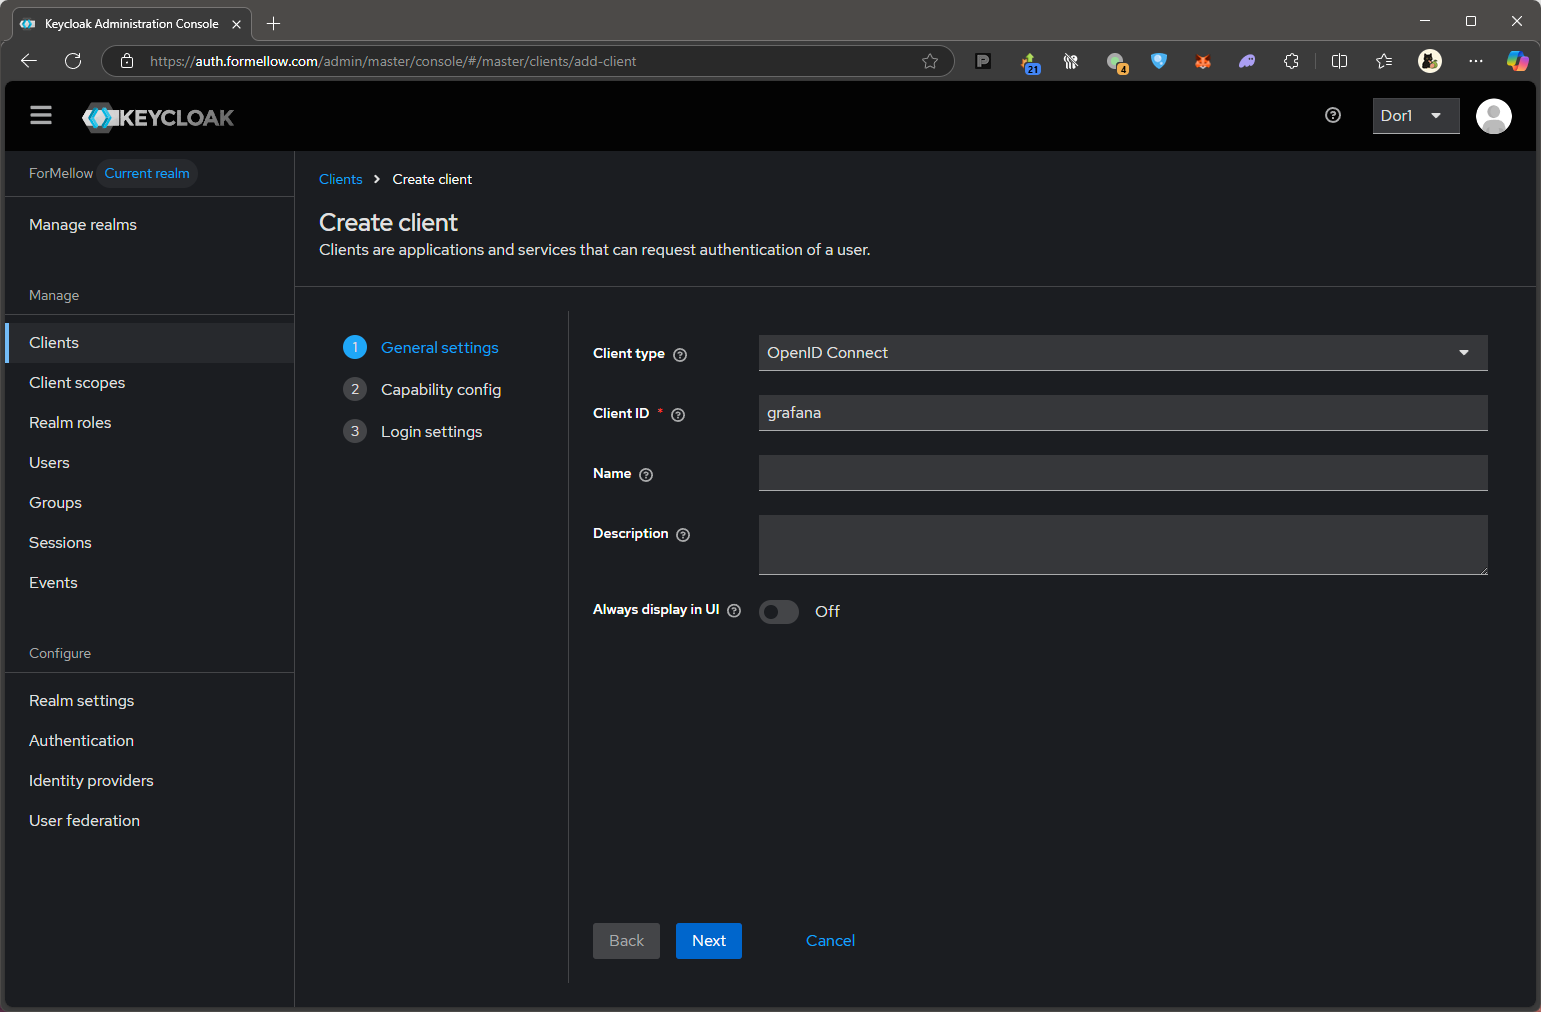 General settings
General settings에서 Client type은 OpenID connect로 그대로 두고 Client ID는 Grafana에 사용해야 하니 적절히 지어준다.
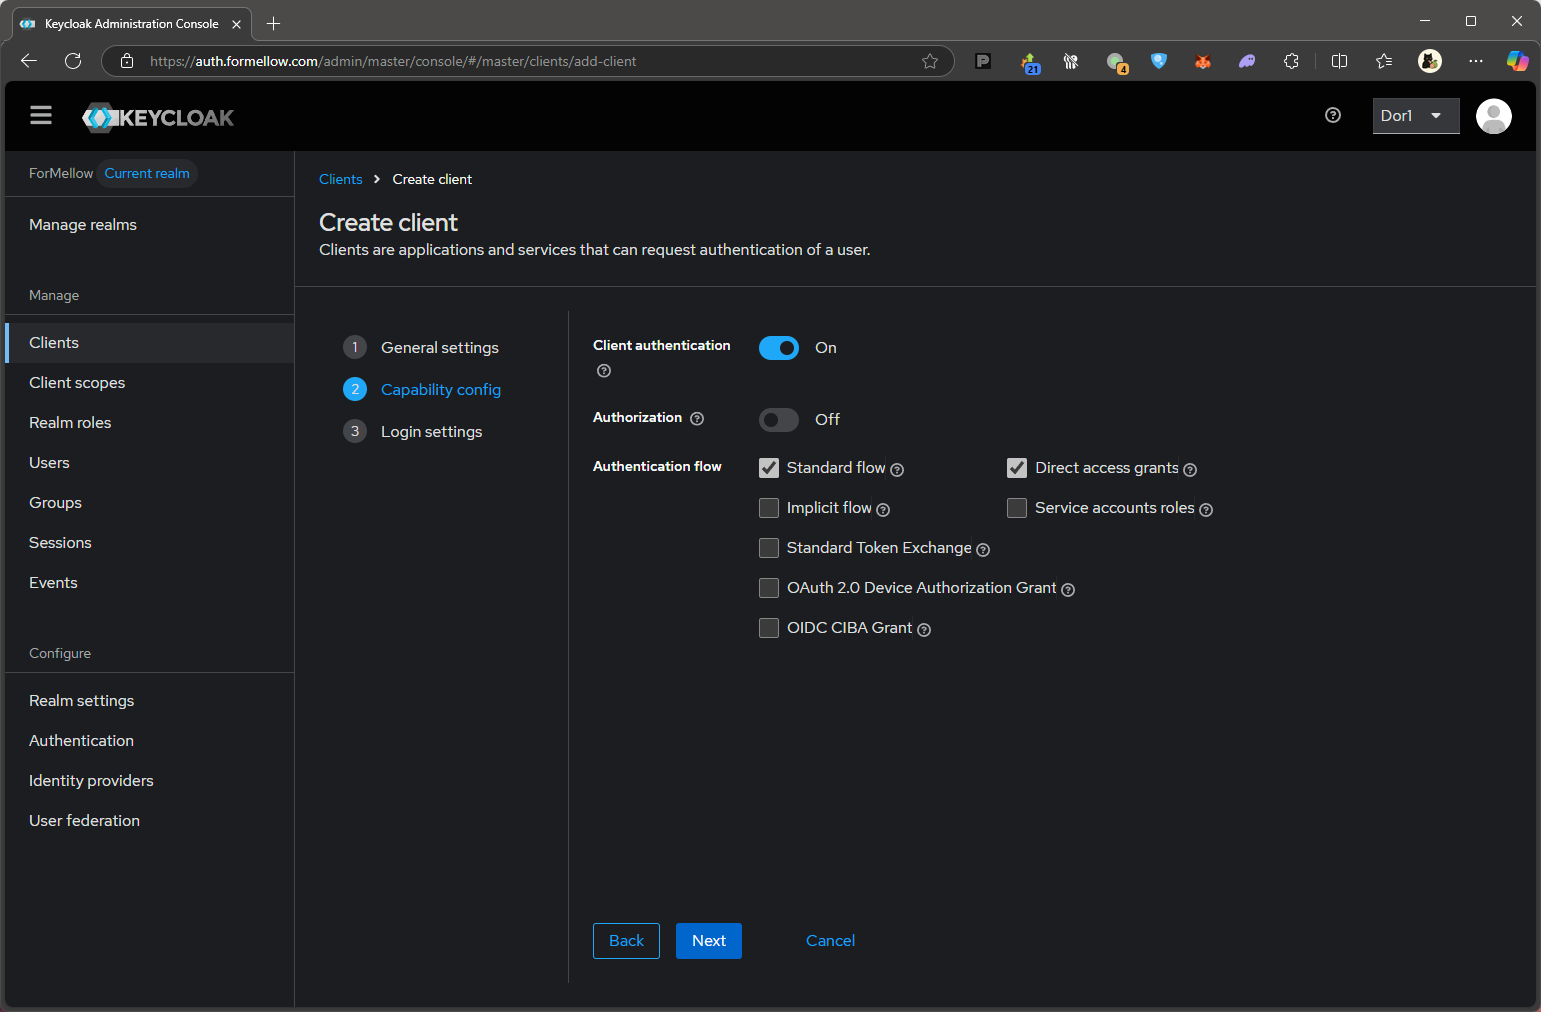 Capability config
Capability config에서는 스크린샷과 같이 체크한다.
- Client authentication
- Authentication flow
- Standard flow
- Direct access grants
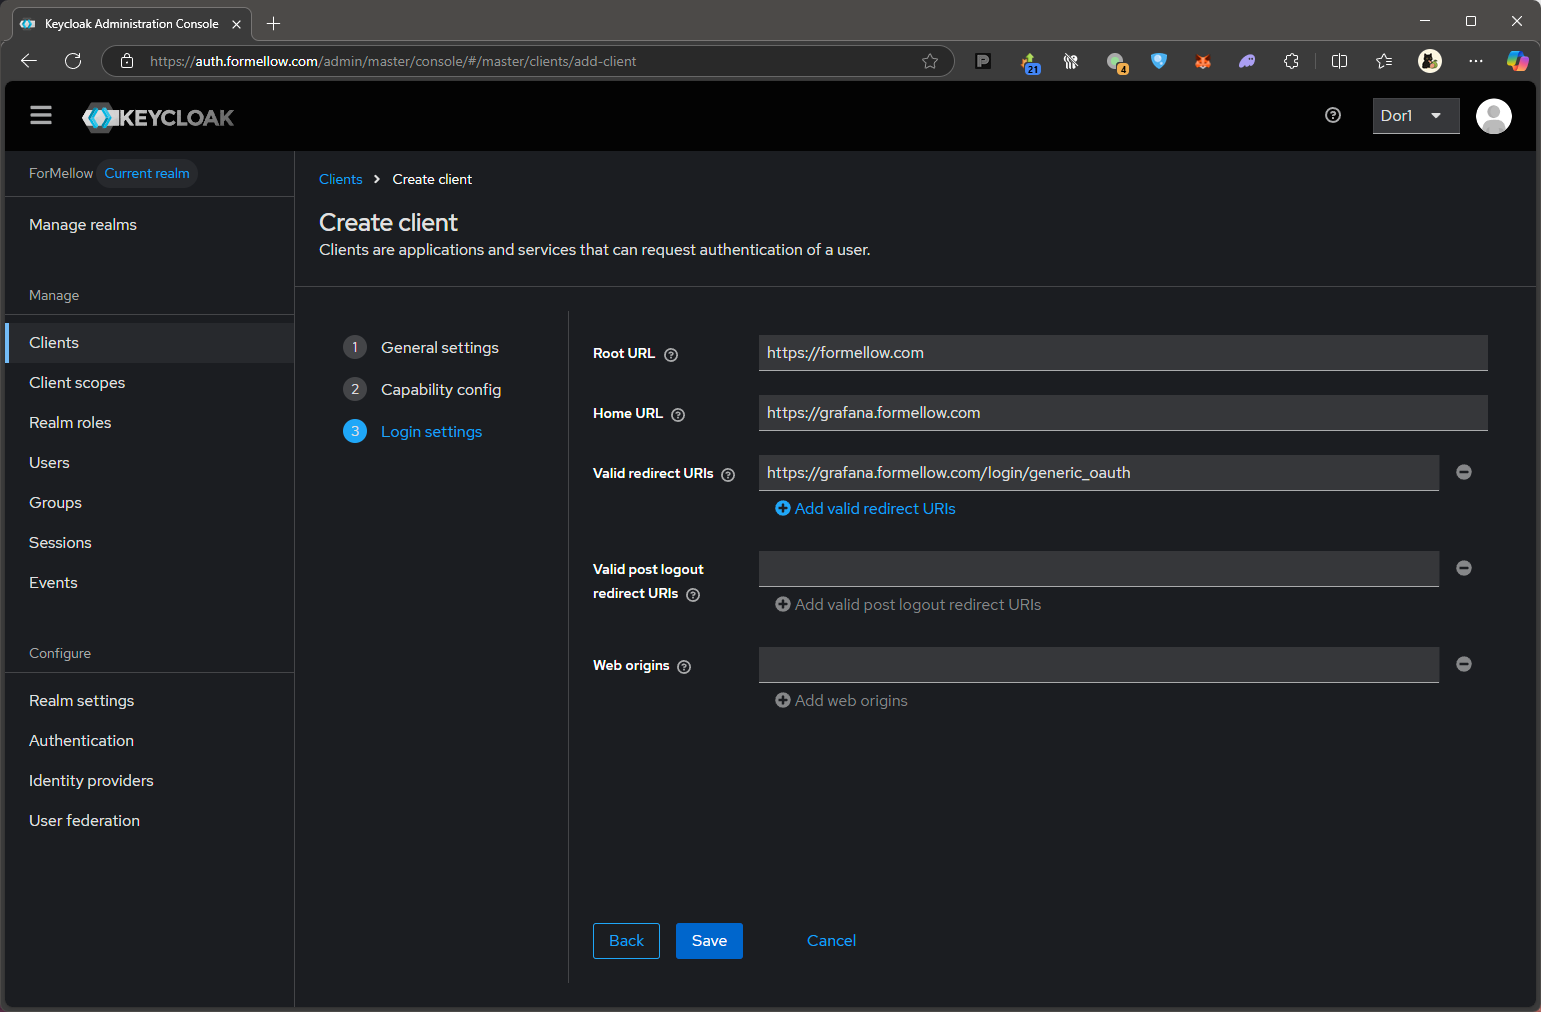 Login settings
Login settings에서는 필수로 적어줘야 하는 곳은 Root URL과 Valid redirect URIs 두 곳이다.
전체적으로 적어줘도 좋으니 스크린샷과 같이 채워준다.
| Field | Description |
|---|---|
| Root URL | 최상위 도메인 |
| Home URL | Grafana URL |
| Valid redirect URIs | |
| Valid post logout redirect URIs | 따로 logout 창이 있을 경우 해당 URL, 없으면 비움 |
| Web origins | CORS 관련 설정이며, 따로 관리 안한다면 비움 |
여기서 Valid redirect URIs 항목은 중요 항목이며 Keylcloak의 유효한 URL를 넣어야한다.
생성 후 좌측메뉴 Mange → Clients → 생성된 client에 접근하여, 상단 탭의 Credentials을 눌러 Client Secret에 대해서 따로 기록한다.
해당 항목은 이후 Token 확인이나 Grafana config에 사용이 된다.
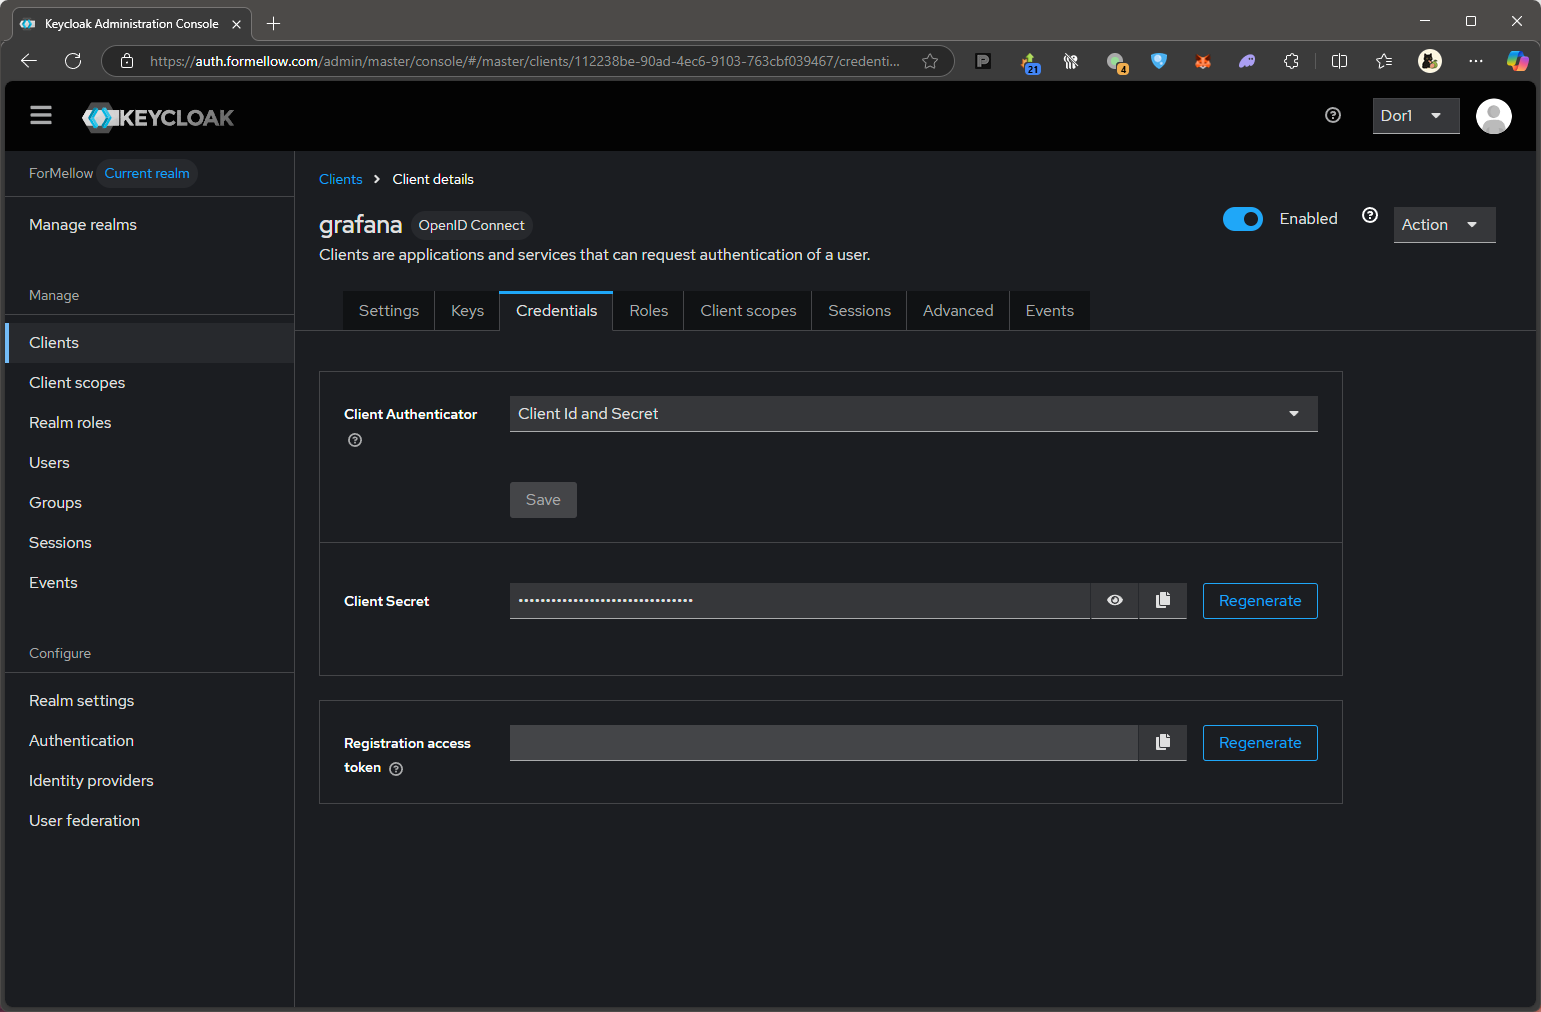 Client Secret 항목 따로 기록
2. Role 생성 및 User 권한 할당
Roles를 생성하는 이유는 Grafana의 Admin, Editor, Viewer의 3가지의 권한에 대해서 사용자에 미리 부여하기위해 사용한다.
Admin과 Editor 두 개만 생성 해주면 나머지는 Grafana설정에서 Viewer로 예외 처리하면 된다.
그리고 추가로 Grafana의 최종 admin을 사용하려면 grafanaadmin이라는 항목도 만들어주는 것이 좋다.
좌측 메뉴 Manage → Clients로 들어가 준 뒤, 위에서 만든 Client에 들어온다.
그 이후 상단 탭에서 Roles탭으로 들어와서 Create role를 눌러서, admin, editor, grafanaadmin에 대해 생성해준다.
공식 사이트에서는 대문자로 생성을 안하고 처리하는 방법을 안내하기 때문에, 소문자로 생성해주면 된다.
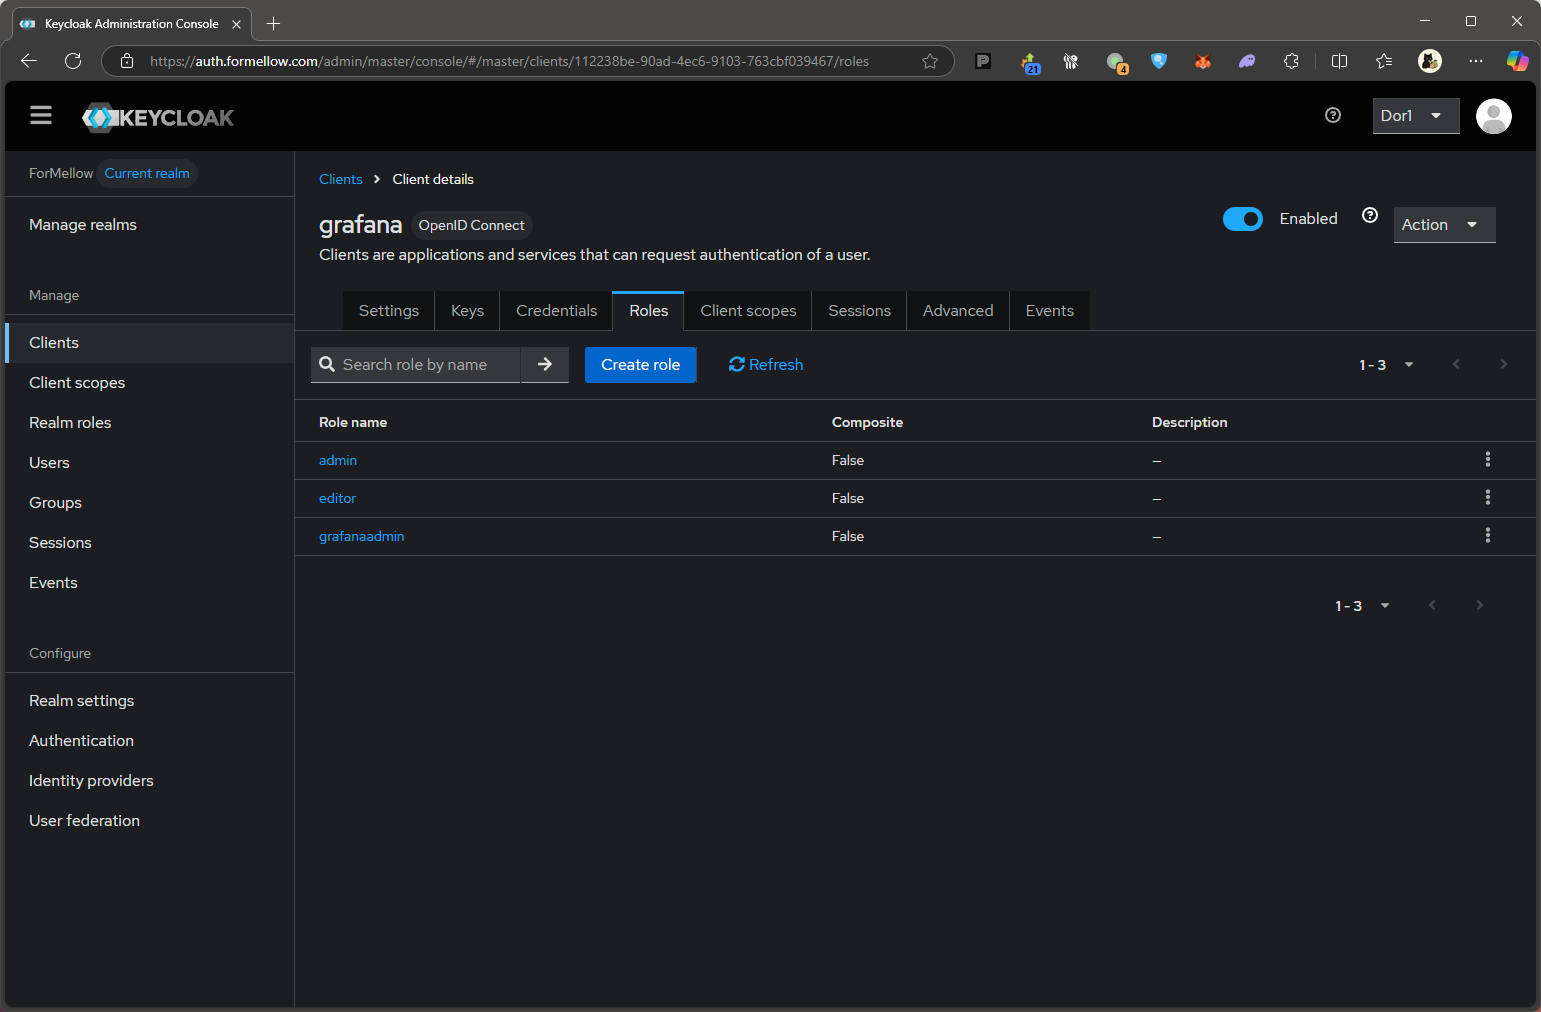 Roles 화면
이렇게 생성을 완료하였으면 사용할 계정에 대해 할당을 해준다.
좌측 메뉴 Manage → Users에 들어가서 권한을 할당할 계정을 선택한다.
이후 상단 탭에서 Role mapping을 들어가서 Assign role을 선택하여 방금 만든 role을 적용 해준다.
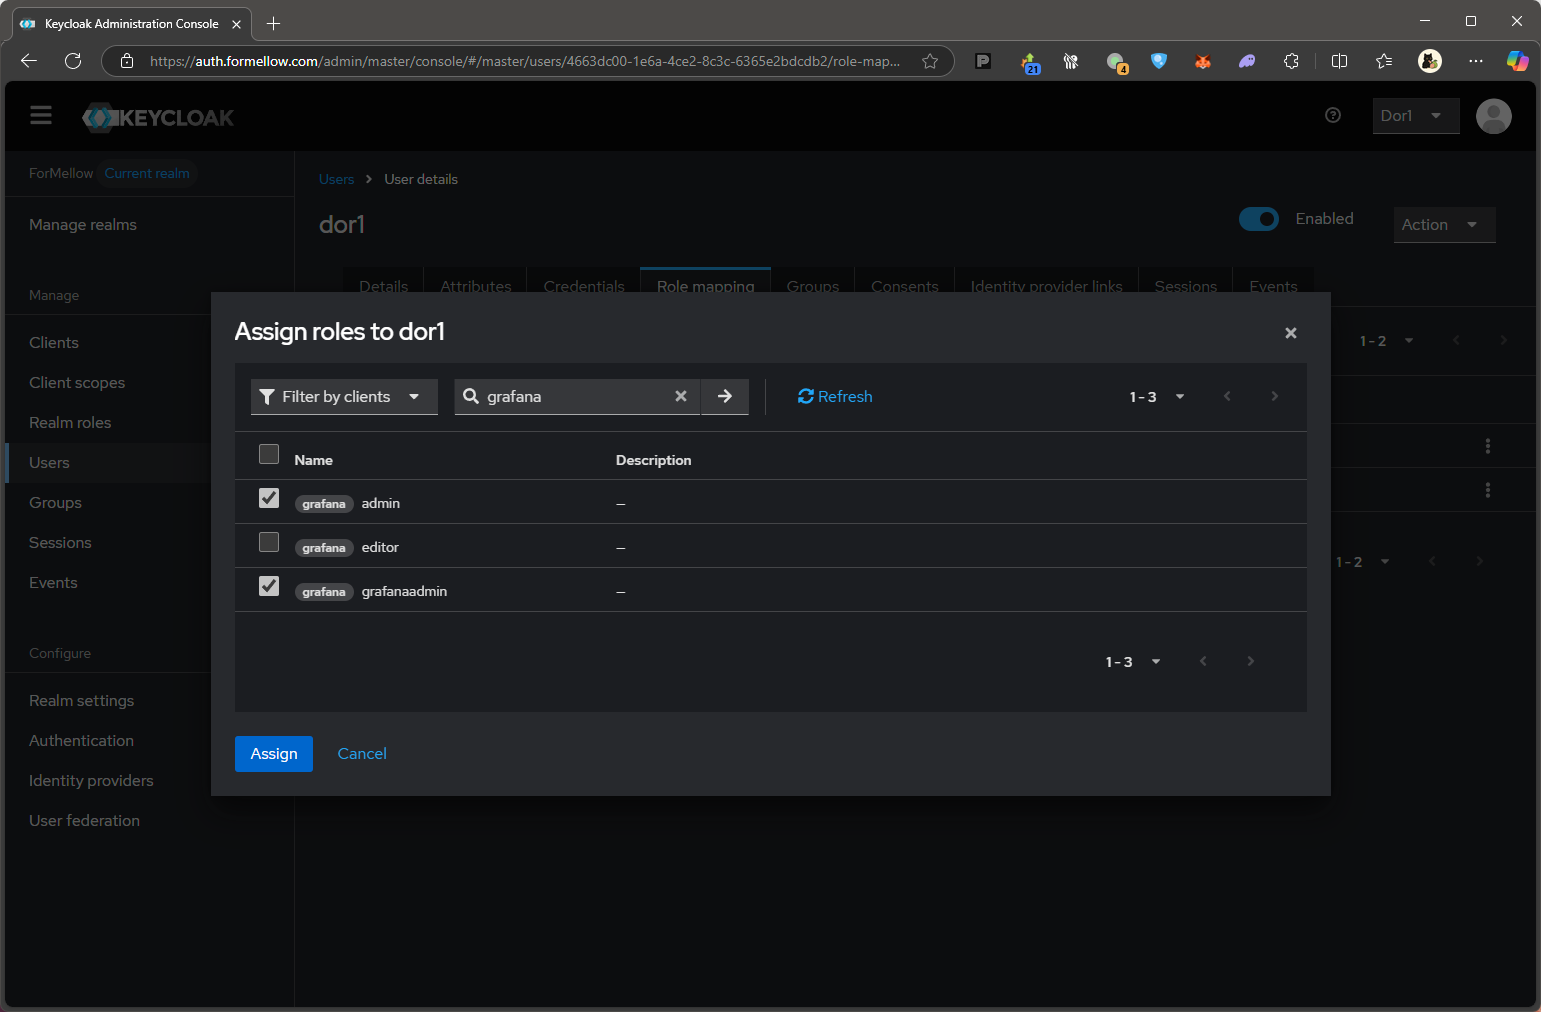 role 할당
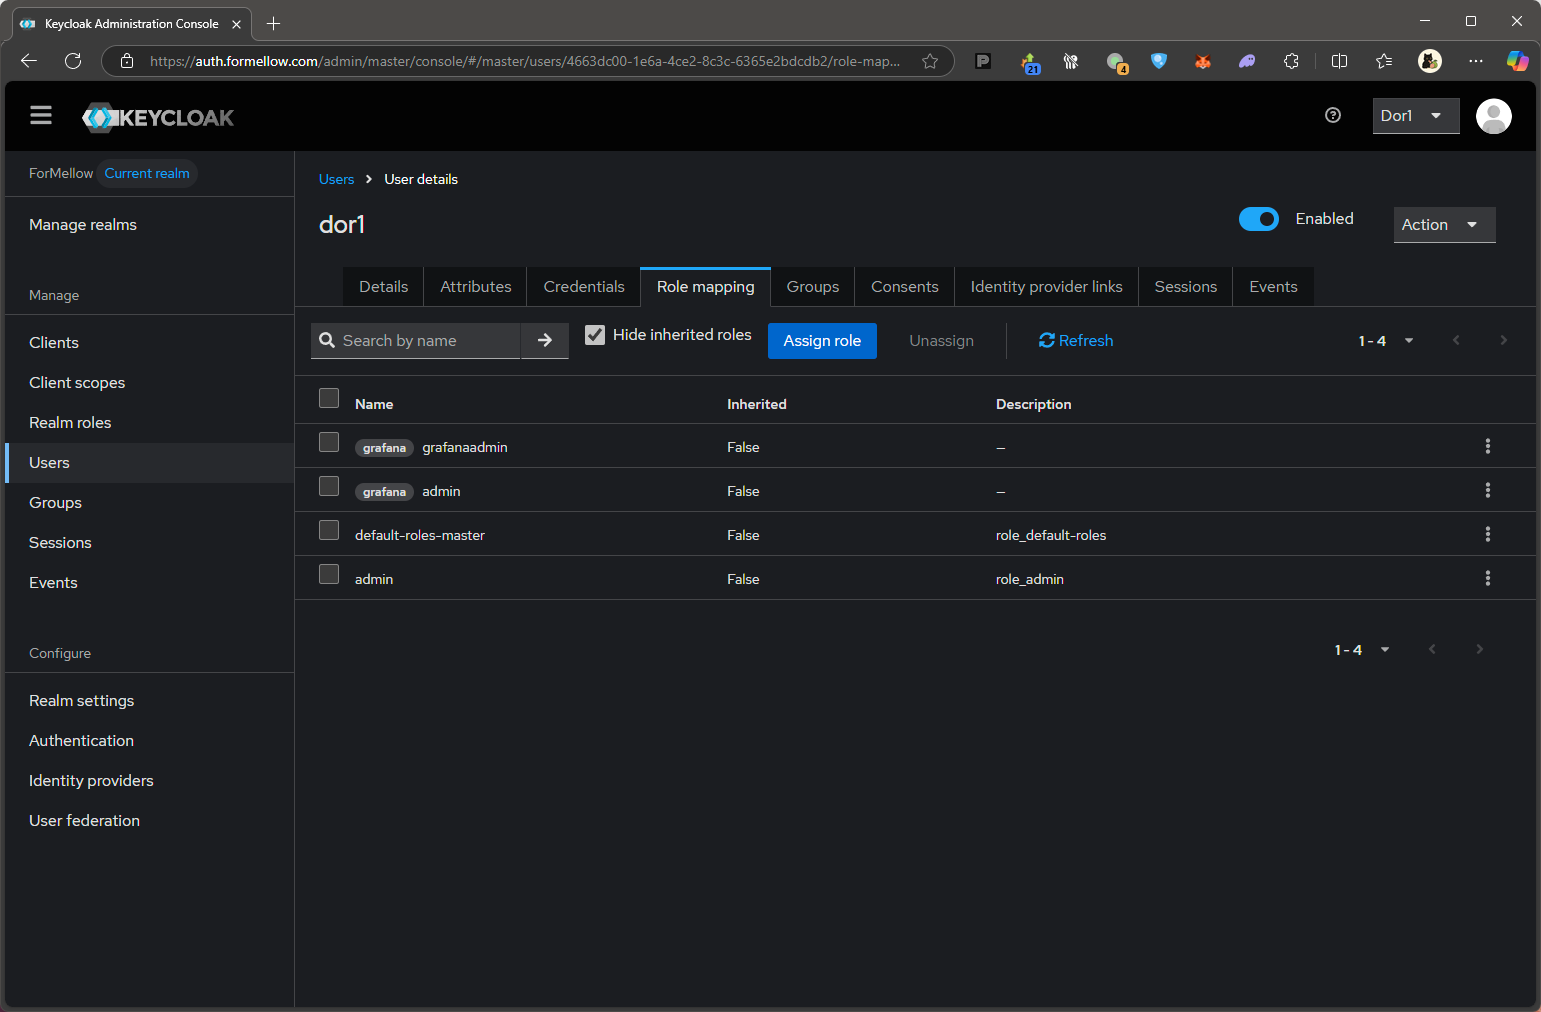 할당 된 화면
여기까지 하면 기본적인 권할 할당은 끝났다.
3. Role mappers를 통한 mapping
위에서 권한 할당을 마무리 했다 하여도 이 작업을 안 하면 실제로 role에 대해 인식을 못한다.
즉, 이 작업은 권한 할당 과정에서 필수다.
좌측 메뉴 Manage → Clients로 이동 후 Client로 들어와준다.
상단 탭에서 Client scopes을 누른 뒤 grafana-dedicated 항목으로 진입한다.
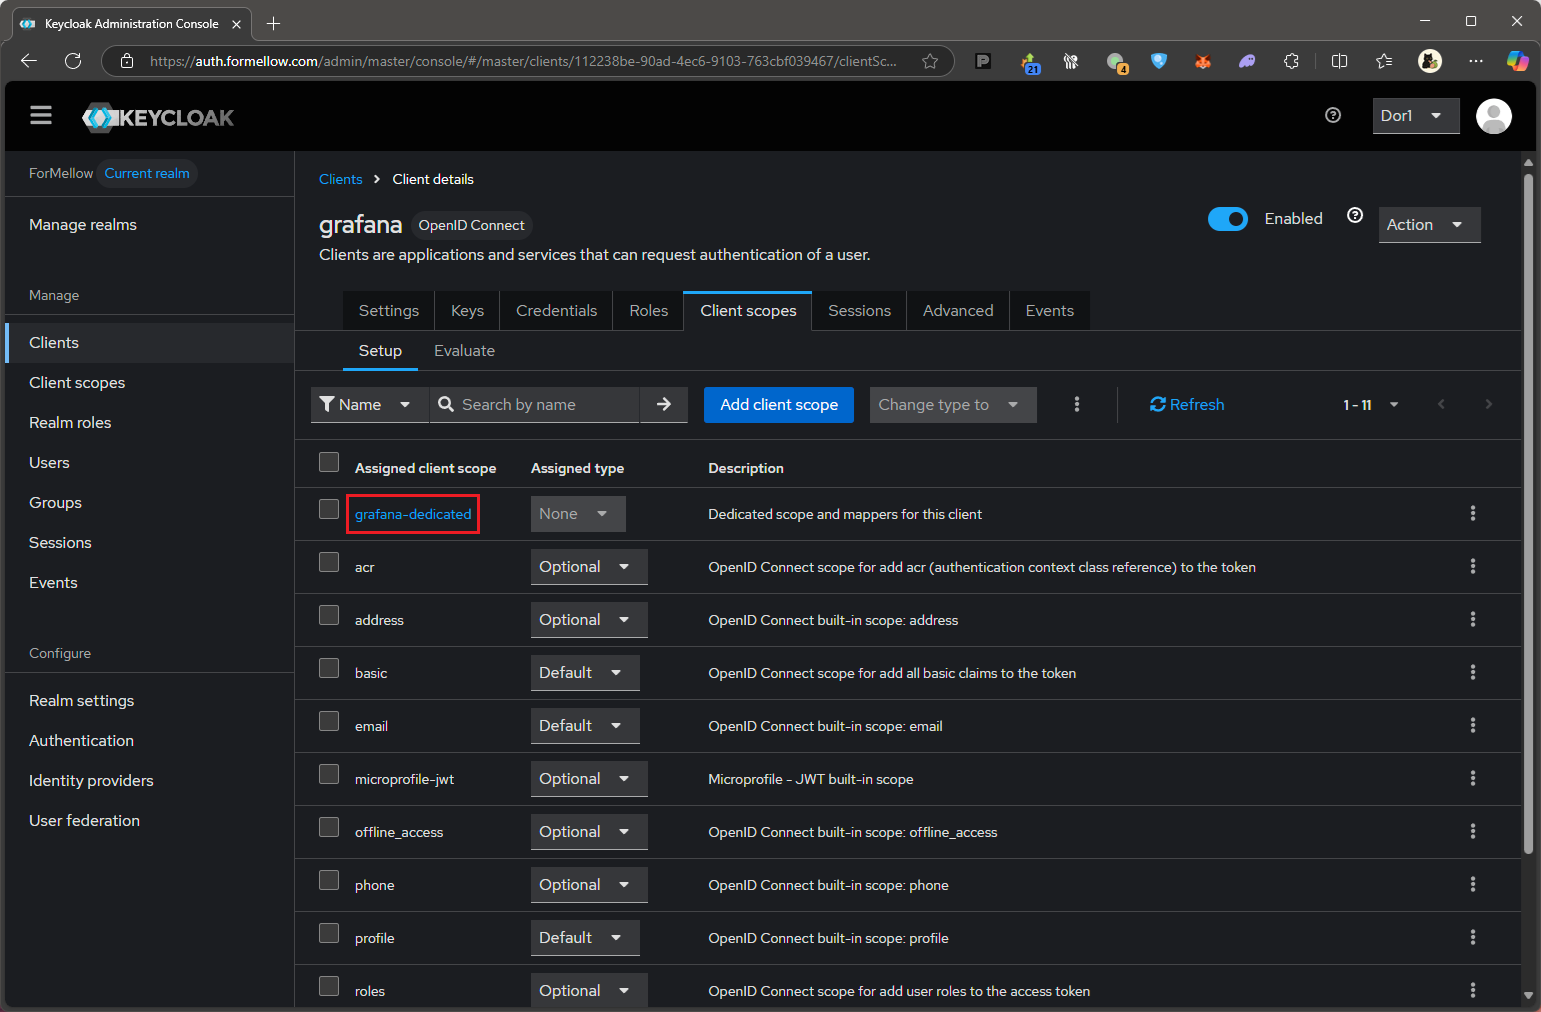 Client scopes 화면
진입하면 상단 탭에서 Scope 항목으로 진입한다.
이후 Full scope allowed 항목을 꺼준다.
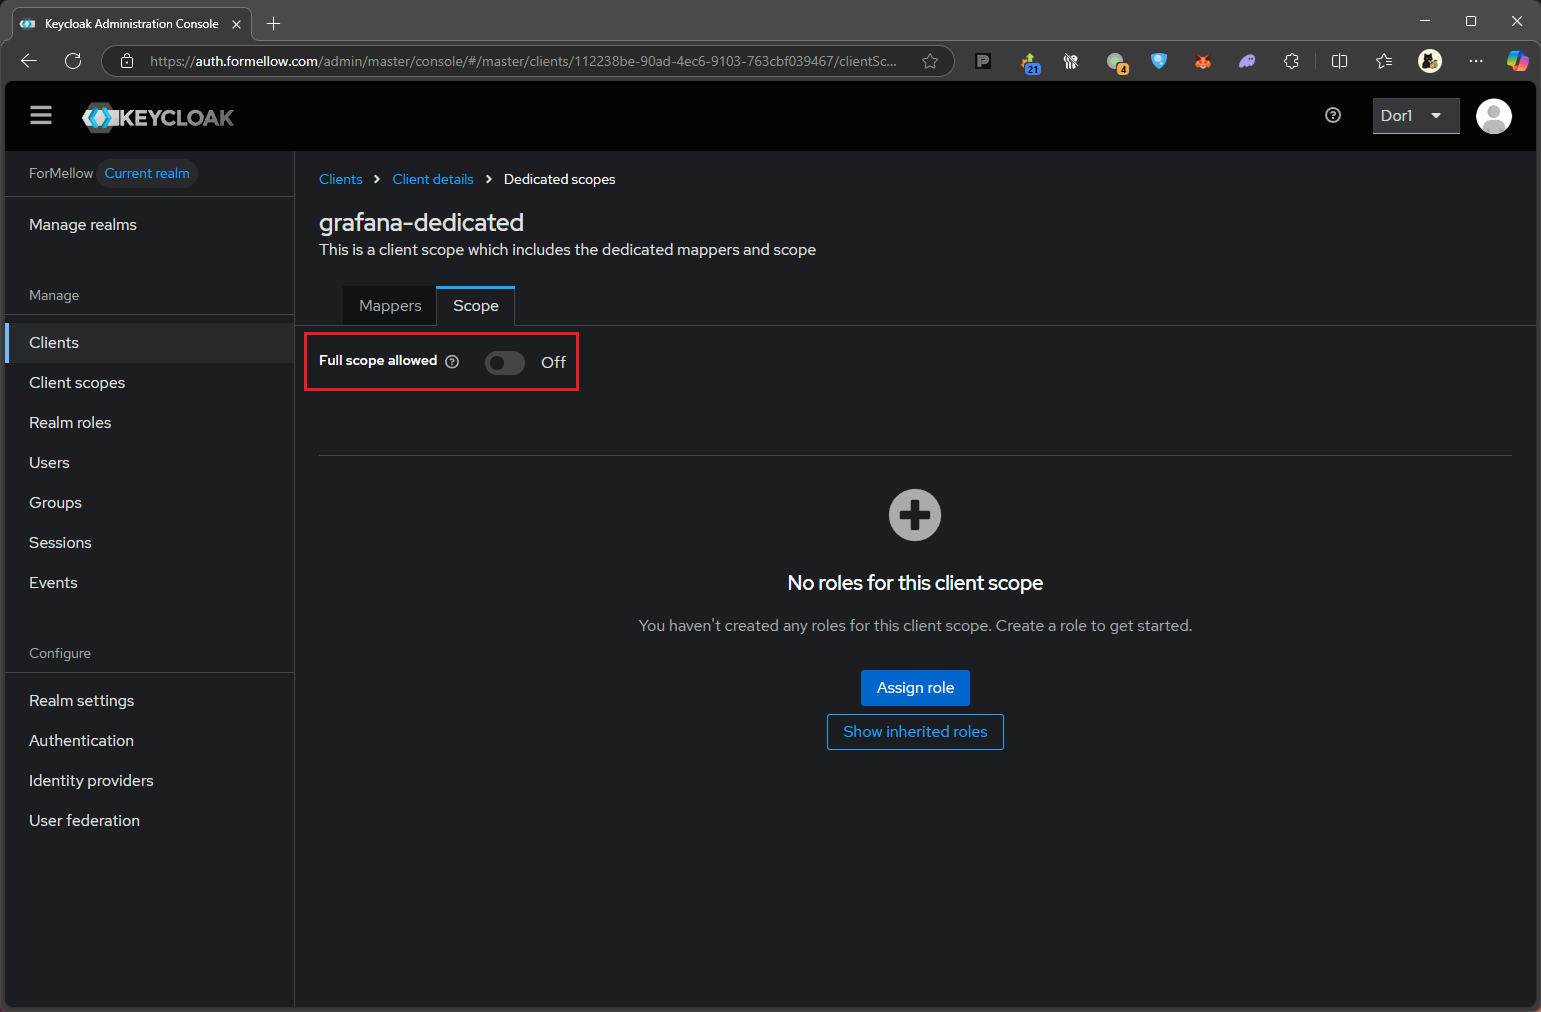 Full scope allowed 항목 Off
이 항목을 꺼주는 이유는 켜져 있으면 realm 내의 client scopes를 모두 가져오기 때문이다.
그렇게 되면 항목이 겹치거나 access에 대해서 문제가 생길 수 있기 때문에 꺼주는 것이 좋다.
다음으로 상단 탭의 Mappers로 이동하여 Add mapper → User Client Role을 눌러 새로 생성한다.
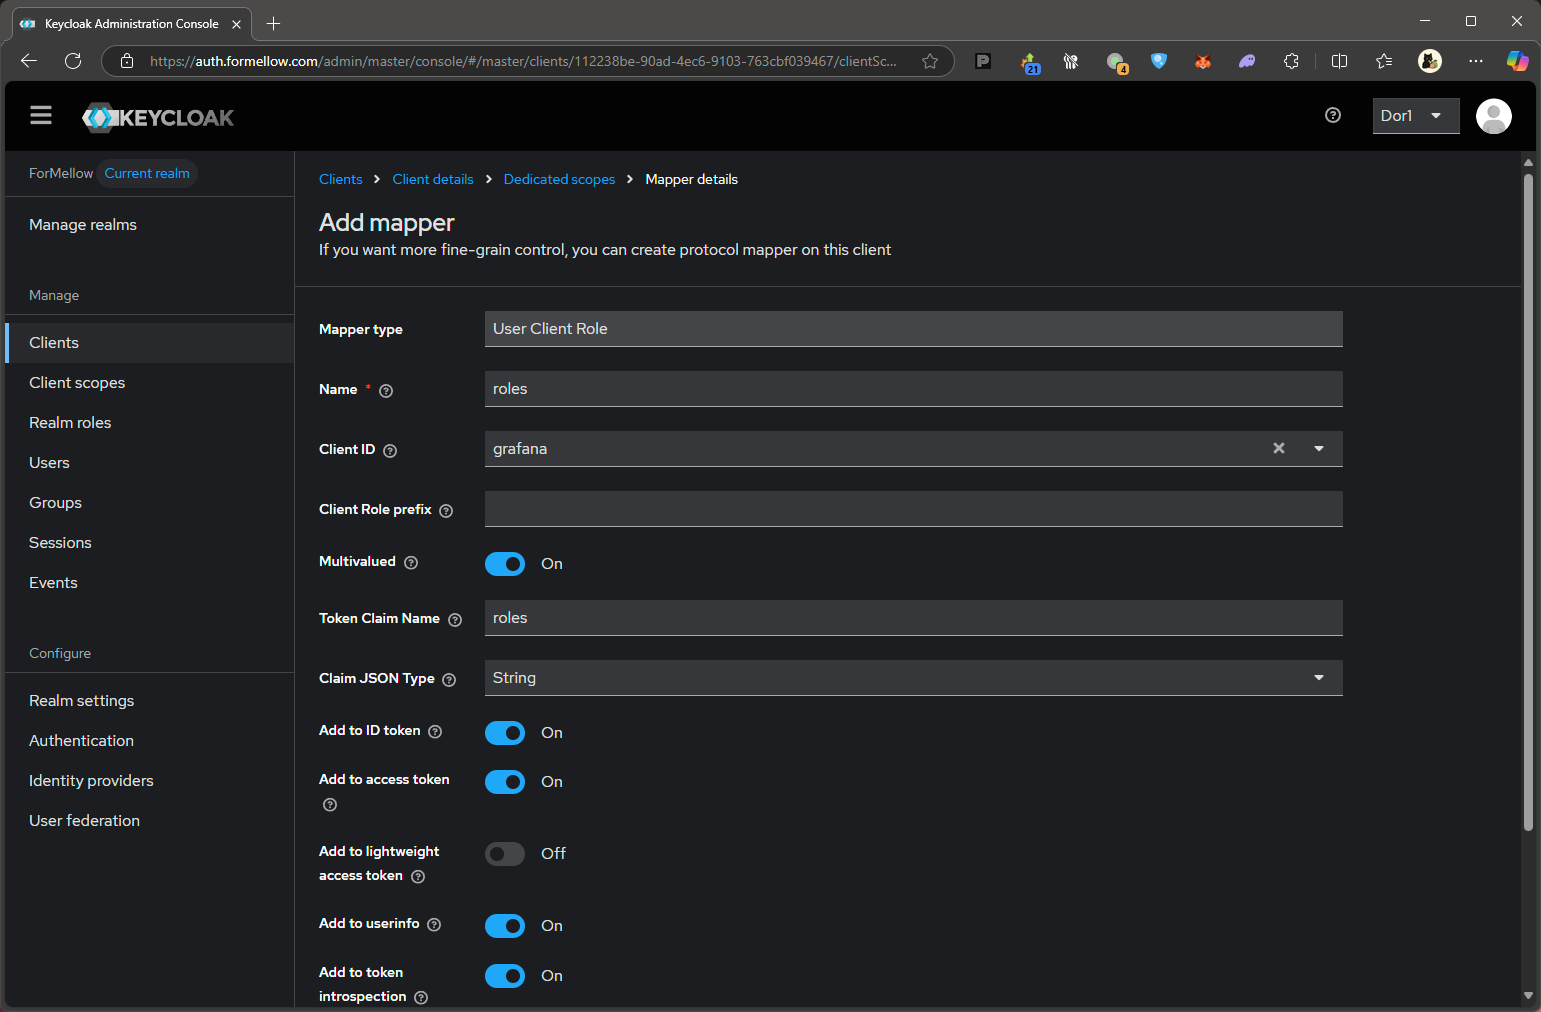 Add mapper 화면
다음과 같이 체크한다.
| Field | Description |
|---|---|
| Name | 적절히 아무거나 적어도 됨 |
| Client ID | Client를 선택 해 줌 |
| Multivalued | On |
| Token Claim Name | roles |
| Claim JSON Type | String |
| Add to ID token | On |
| Add to access token | On |
| Add to userinfo | On |
| Add to token introspection | On |
다음의 항목은 똑같이 해야 error가 발생하지 않는다.
Token Claim Name, Claim JSON Type, Add to ID token, Add to access token, Add to userinfo
4. Token 확인
정상적으로 입력이 되어있는지 Token 값을 확인해야 한다.
방법으로는 여러가지가 있지만, 여기서는 제일 효율적인 cURL과 Postman을 이용하는 방법을 이용해봤다.
cURL로 확인
cURL로 확인 시에는 MFA 또는 Webauthn(Passkey)와 같은 것이 설정 되어있지 않아야 작동이 된다.
curl이 설치된 곳에서 아래와 같이 입력한다.
1
2
3
4
5
6
7
curl -X POST <KEYCLOAK_URL>/realms/<REALMS>/protocol/openid-connect/token \
  -H "Content-Type: application/x-www-form-urlencoded" \
  -d "grant_type=password" \
  -d "client_id=$CLIENT_ID" \
  -d "client_secret=$CLIENT_SECRET" \
  -d "username=$KEYCLOAK_USER" \
  -d "password=$KEYCLAOK_USER_PASSWORD"
입력하면 JSON 형식으로 나오는 token 을 다음의 사이트에서 decode하여 확인하면 된다.
https://jwt.io/
아래와 같이 나오면 제대로 입력이 된 것을 확인할 수 있다.
1
2
3
4
5
6
7
8
9
10
{
...

 "roles": [
        "admin",
        "grafanaadmin"
    ],

...
}
Postman으로 확인
Postman은 API 관리에 매우 유용한 툴이다.
메뉴에서 좌측상단 My Workspace → New → HTTP를 눌러 새로 생성한다.
GET 항목에는 다음과 같이 입력한다.
1
<KEYCLAOK_URL>/realms/<REALMS>/protocol/openid-connect/userinfo
Authorization의 탭을 누른 뒤 Auth Type은 OAuth 2.0으로 선택한다.
이후 Confiture New Token 이하 항목에 다음과 같이 입력한다.
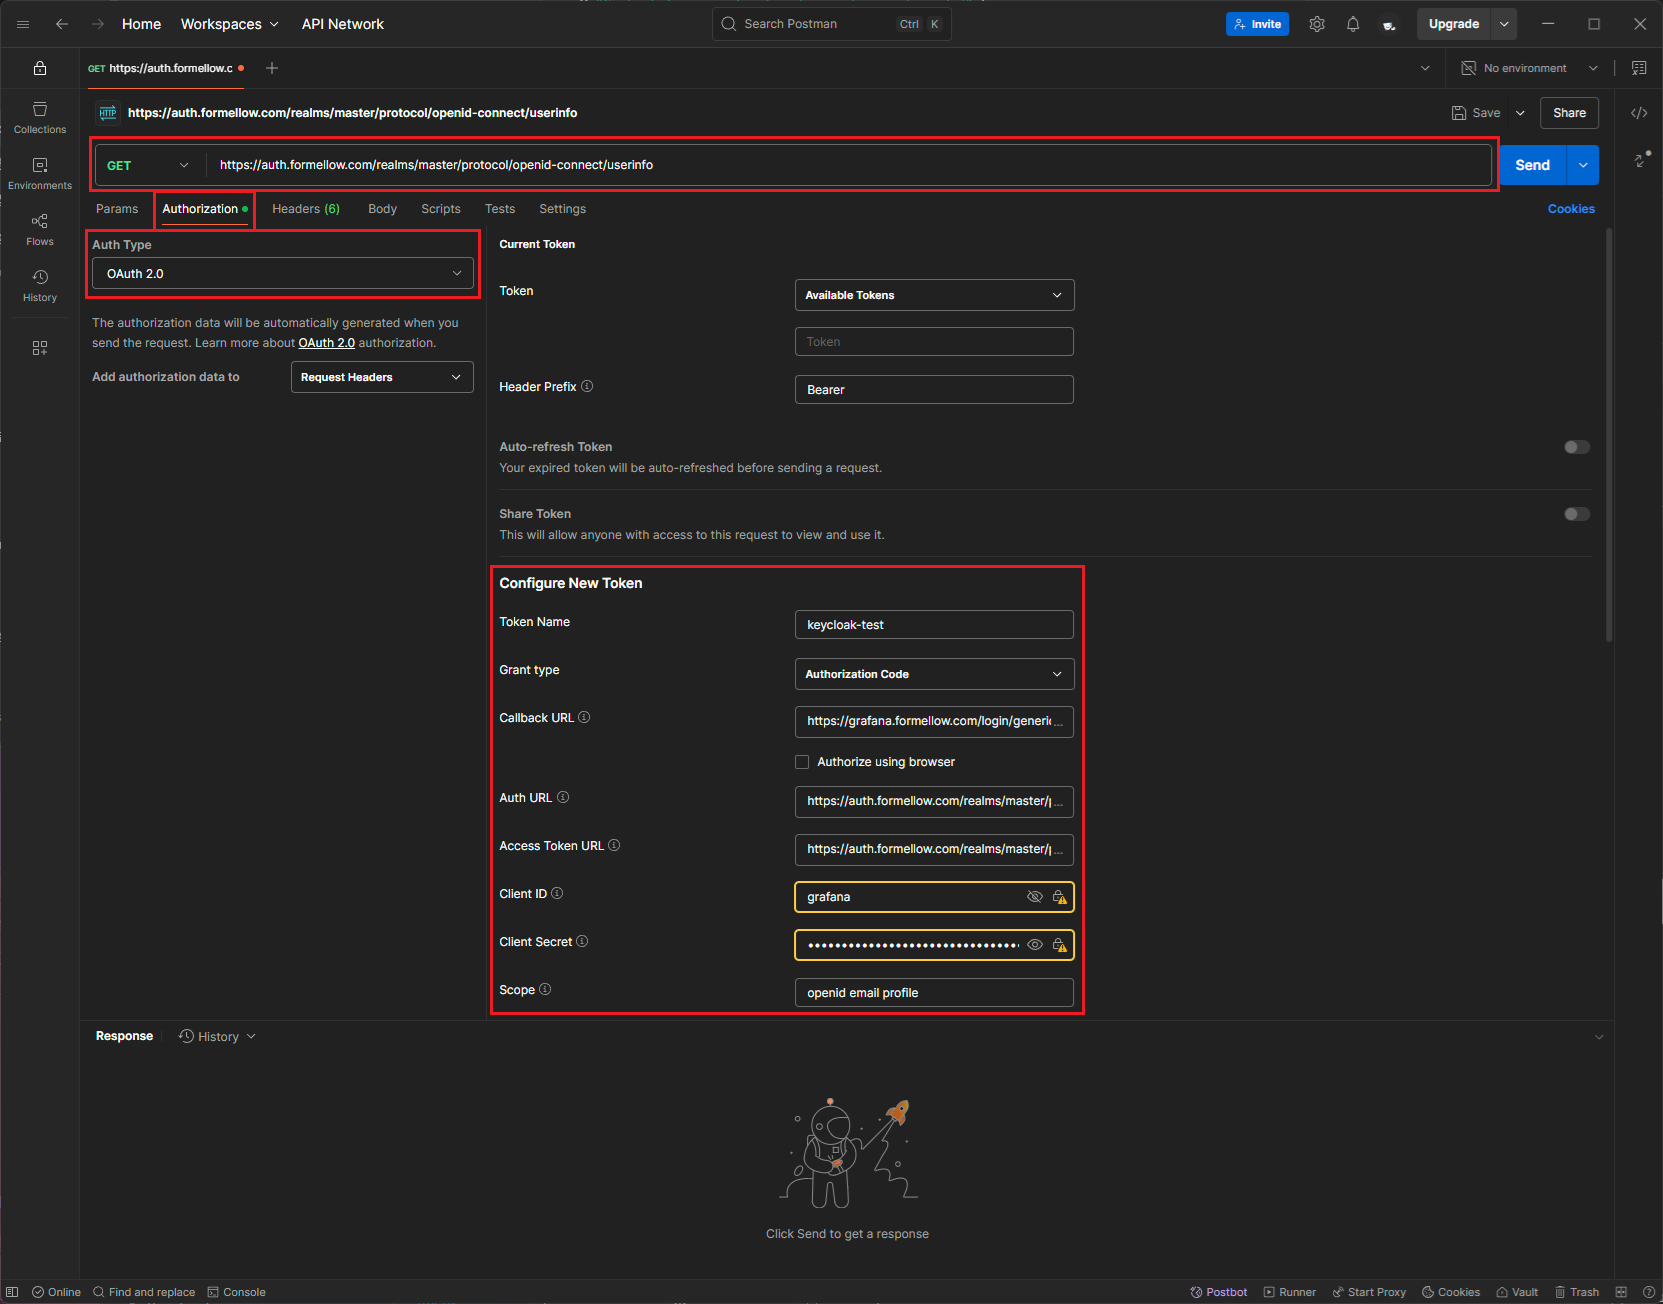 Postman
| Token Name | Contents |
|---|---|
| Grant type | Authorization Code |
| Callback URL | |
| Auth URL | |
| Access Token URL | |
| Client ID | YOUR_CLIENT_ID |
| Client Secret | YOUR_CLIENT_SECRET |
| Scope | openid email profile |
입력이 완료 되면 가장 밑으로 창을 내려 Get New Access Token을 눌러 로그인을 한다.
로그인 후 Proceed → User Token을 누르면 상단에 Bearer 형식으로 User Token Type 칸이 입력 되어있는 것을 확인 할 수 있다.
그리고 Send를 누르면 200 OK와 함께 확인이 가능하다.
다음과 같이 나오면 제대로 입력이 된 것이다.
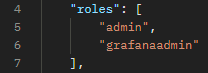 roles 확인
Grafana에서 작업
Grafana에서는 grafana.ini 에서 추가 작업만 해주면 된다.
auth.generic_oauth 부분이 OAuth를 담당하는 부분이기 때문에 이곳을 수정해준다.
1
2
3
4
5
6
7
8
9
10
11
12
13
14
15
16
17
18
19
20
21
22
23
24
dor1@Nukumori > /volume1/docker/data/monitoring/grafana/config ❯ sudo vi grafana.ini

...

#################################### Generic OAuth ##########################
[auth.generic_oauth]
enabled = true
name = Keycloak
allow_sign_up = true
client_id = grafana
client_secret = $CLIENT_SECRET
scopes = openid email profile
login_attribute_path = preferred_username
email_attribute_path = email
auth_url = https://auth.formellow.com/realms/master/protocol/openid-connect/auth
token_url = https://auth.formellow.com/realms/master/protocol/openid-connect/token
api_url = https://auth.formellow.com/realms/master/protocol/openid-connect/userinfo
# keycloak role에서 소문자로 만든 권한에 대해서 적용
role_attribute_path = contains(roles[*], 'grafanaadmin') && 'GrafanaAdmin' || contains(roles[*], 'admin') && 'Admin' || contains(roles[*], 'editor') && 'Editor' || 'Viewer'
tls_skip_verify_insecure = true
# GrafanaAdmin 권한을 갖고 있는 user에게는 Grafana의 Admin 적용
allow_assign_grafana_admin = true

...
이렇게 한 뒤 docker restart grafana를 해주면 Grafana에 Sign in with Keycloak이라는 항목이 생겼을 것이다.
로그인을 해본 뒤 권한을 확인해보면 정상적으로 Admin이 들어가 있는지 확인이 가능하다.
Administration -> Users and access -> Users으로 접근하여 확인해본다.
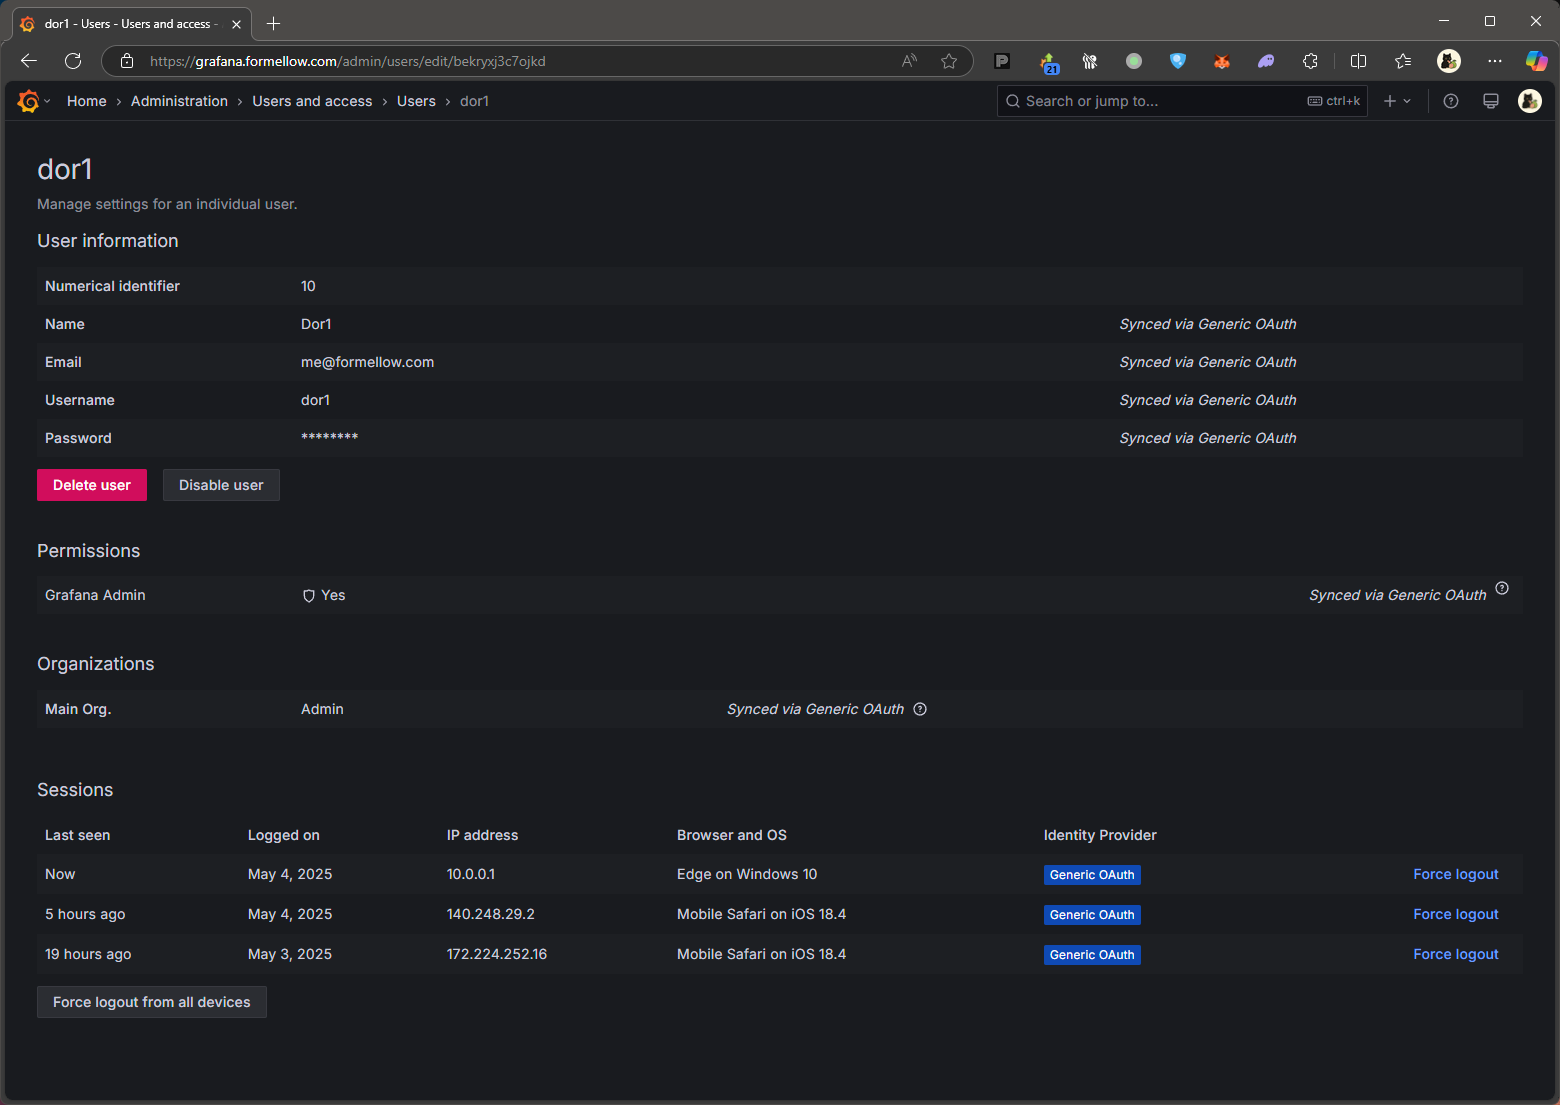 Admin 권한 확인